
Last quarter we talked about the Q4 correction and a general feeling of unease on the part of investors about the length of economic expansion and bull market in Canadian and U.S. stocks. To recap, the Canadian and U.S. economies and stock markets have been in an expansive or “bull” phase since the financial crisis in 2009. In the ten year period since the U.S. stock market bottomed during the financial crisis (i.e. ~ March, 2009 to March 2019) the S&P 500 index gained more than 312 percent1.
Some time we ago, we wrote about “market cycles” (the upward march of the stock market over time that is interrupted at intervals by “corrections”). These cycles are driven by the economy, corporate profits, and investor sentiment (i.e. how investors collectively feel about the future prospects for stocks). As we have previously discussed, sentiment can swing wildly from optimism to fear / skepticism. To give you some perspective, the past decade has been characterized by bullish sentiment (generally) and a prolonged increase in corporate profits and hence, stock prices. Consider the following chart of S&P 500 bull and bear markets since 1957, courtesy of Mackenzie Investments2:
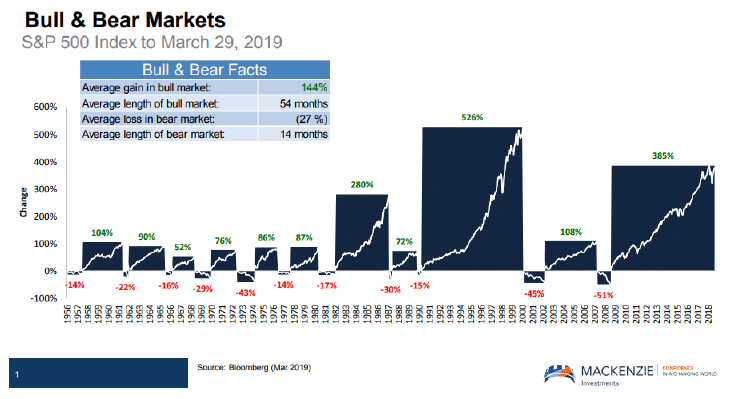
A glance that at this chart might prompt some to extrapolate a correction in U.S. stocks. After all, the principle of “mean-reversion” (i.e. what goes up, above the long-term-average, will eventually revert to the “mean”, or average) is often a useful rule of thumb. Many investors are increasingly worried about the fact that the recent bull market in stocks is looking long in the tooth. We repeatedly hear comments that the economy and / or stock market are in the “late innings” of the current cycle.
Here is Bill Miller in an April 2019 note to investors:
“The bull market that began in early March 2009 passed its 10th birthday last month, something no one expected when the S&P 500 bottomed at 666. The economic expansion that has accompanied it — as usual, the market led the beginning of the expansion by about 6 months — will become the longest in history when, as appears likely, it surpasses the previous record later this year. While this has generated the usual angst and fretting about when the inevitable recession, and concomitant bear market, will occur, it is worth noting that Australia is in its 28th year of continuous expansion3”.
It’s not just the length of the bull market that has investors worried. Valuations look high (relative to historical averages) after a long run up in prices.
Jeremy Grantham, co-founder and chief investment strategist of Grantham, Mayo, & van Otterloo (GMO), a Boston-based asset management firm, wrote a compelling article in 2017, in which he made some keen observations that relevant to our discussion.
Grantham related that for 60 years or so (1935-1995), U.S. stocks behaved with some regularity – stocks “reverted to the mean” (i.e. periods of high valuation were followed by corrections to the then long run historical average). But Grantham points out that valuations have been consistently higher for the 20 year period of 1997-2017. This situation has persisted following Grantham’s study – the P/E ratio of the S&P 500 is ~ 21 at time of writing4. Those betting on reversion to the mean over this period have been wrong (so far).
As Grantham explains, “Exhibit 1 shows what happened to the average P/E ratio of the S&P 500 after 1996. For a long and painful 20 years – for someone betting on a steady, unchanging world order – the P/E ratio stayed high by 1935-1995 standards. It still oscillated the same as before, but was now around a much higher mean, 65% to 70% higher!5”
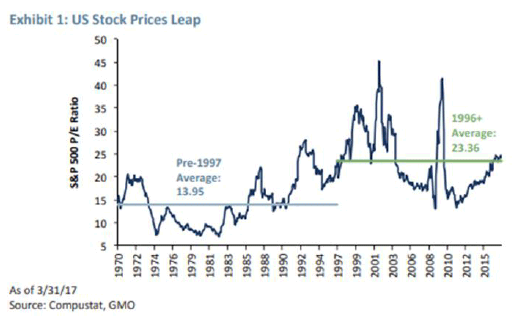
And it is interesting to note that the S&P 500 has been remarkably resilient over the past 20 or so years. Every big decline in the S&P 500 has been short lived. In reference to the chart below, Grantham stated, “Even in 2009, with the whole commercial world wobbling, the market went below trend for only six months6”.
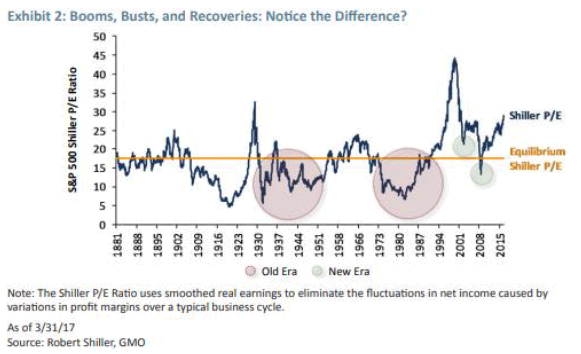
In contrast, Grantham explains that in the wake of past “bubbles” such as that witnessed in “in the US in 1929 and 1972 (Exhibit 2) or Japan in 1989”, these markets “stayed below [trend] for an investment generation, waiting for a new crop of more hopeful investors7”. Remember the “Santa slump” in December, 2018? It sure didn’t take long for stocks to recover.
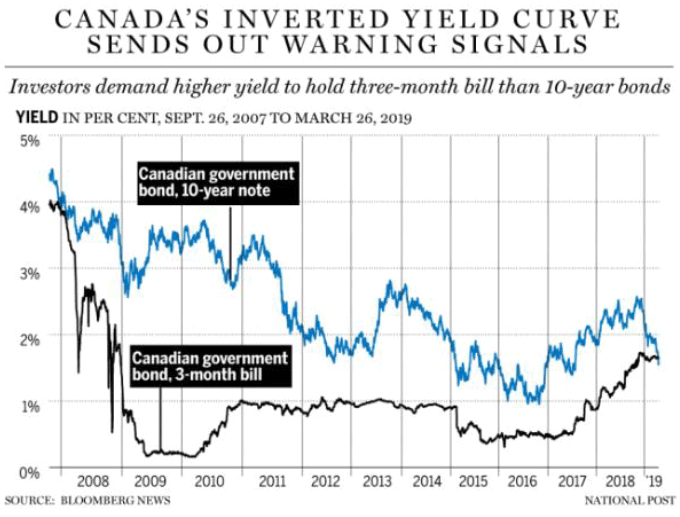
Adding to worries, we have recently witnessed indicators of a possible recession in Canada and the U.S. This angst was heightened by a recent occurrence of an ominous economic indicator – a “yield curve inversion”. Let us explain. The yield curve is simply a picture or a graph of the rates of return, or yield, of bonds of different lengths of maturity. Normally, the yield curve is upward sloping, meaning the yield on “fixed income securities” (think: GICs, bonds) is higher as the term of the borrowing is lengthened (all else being equal). This makes perfect sense.
As a lender, you would demand a higher interest rate for a 30-year loan than you would for a 1-year loan. Occasionally, this relationship is flipped or inverted meaning that the market yield on longer term fixed income securities is lower than shorter term comparable securities. This “inversion” was witnessed in Canada and the U.S. in late March 2019. Today, the yield curve in Canada and the U.S. is as flat as a pancake. Consider the following chart8:
Why does this happen and what does it mean?
This inversion phenomenon is thought of as a potential indicator of recession. Why is this so? Here is an explanation from a recent Bloomberg article: “The yield curve has historically reflected the market’s sense of the economy, particularly about inflation [and growth]. Investors who think inflation will increase will demand higher yields to offset its effect. Because inflation usually comes from strong economic growth, a sharply upward-sloping yield curve generally means that investors have rosy expectations. An inverted yield curve, by contrast, has been a reliable indicator of impending economic slumps9”.
Historically, we have witnessed this inversion phenomenon prior to recessions. The U.S. three-month Treasury bill /10-year Treasury bond spread has inverted before every one of the past seven recessions10. But, importantly, it is not a perfectly reliable indicator. It often portends recession but not always. It is important to know that the yield curve is only an expression of investors’ views about the future. And views on such things can be wrong.
So, it is understandable that investors are worried – valuations have been persistently higher than the very long run historical average, the length of the current bull market is one of the longest on record and a recent yield curve inversion is flashing warnings of a possible recession.
However, the main the point of this quarter’s letter is this:
- That the market has advanced for several years doesn’t necessarily mean that stocks are likely to go down or will “mean-revert”. We cannot rule out the possibility that valuations might durably stay higher for many years;
- As we noted, U.S. stock prices (valuations, or P/E ratios to be more precise) have remained persistently high over the past 20 years. Generally we are not “new era” thinkers but we must be open to the possibility of a long-term structural change (more on that later); and
- That the U.S. economy has expanded for several years does not necessarily mean that recession is imminent. These things tend to be cyclical but there is no regularity to the economy or stocks. We know that cycles (with respect to stocks and the business cycle) tend to recur but we know little (before the fact) about the amplitude or timing of these cycles. And you have heard from us ad nauseam about the futility of predicting “macro” events such as the economy or stocks.
Investors ought to take pronouncements of an impending recession or stock market correction with a grain of salt. They might do more harm than good. There is always a counter argument and reason for optimism.
Bill Miller makes this very point in his Q1 2019 letter to investors11:
“Another exploitable behavior that has harmed investors’ results for the past decade is the attempt to forecast the twists and turns of the US or global economy, usually on a short-term basis, and to adjust portfolios accordingly. The motivation here is to try to avoid a recession and bear market. I agree with the remarks of Peter Lynch, Fidelity’s great portfolio manager, who said he did not spend 15 minutes a year trying to forecast the economy. He said he believed that more money was lost worrying about or preparing for recessions than was lost in the recessions themselves [emphasis, ours]. This was particularly evident during the euro crisis of 2011, the so-called Taper Tantrum of 2013, the recession scare at the beginning of 2016, the sharp drop in the fourth quarter of 2018, and again in March of this year. In each case, the stock market sold off sharply because of macroeconomic fears, and in each case those fears proved erroneous. The market reversed course as soon as investors had adjusted their portfolios for what never happened. Trying to surf the market according to the flow of macro data added no value but did hurt performance”.
There are legitimate arguments for optimism regarding the outlook for stocks. In this quarter’s letter, we share a few.
First, it is important to point out that it is a perfectly normal state of affairs for stock indices such the S&P 500 to be setting new highs over time. We recall the S&P at ~ 400-425 in the early 1990’s. Today it is over 2900. To what can we attribute this increase? Largely, stocks go up because earnings go up (there are other factors, to be sure, but they tend to cancel out in the long run). And earnings go up because businesses grow and innovate and new businesses emerge to create new sources of earnings.
Today, the S&P 500 index components with the largest weightings (3/31/2019) are Microsoft Corp (3.83%), Apple Inc. (3.60%), Amazon.com Inc. (3.11%), Facebook Inc. (1.68 %), and Alphabet Inc. (3.02%)12. In contrast, here are the largest components by weight in 1990, courtesy of Ritholtz Wealth Management13:
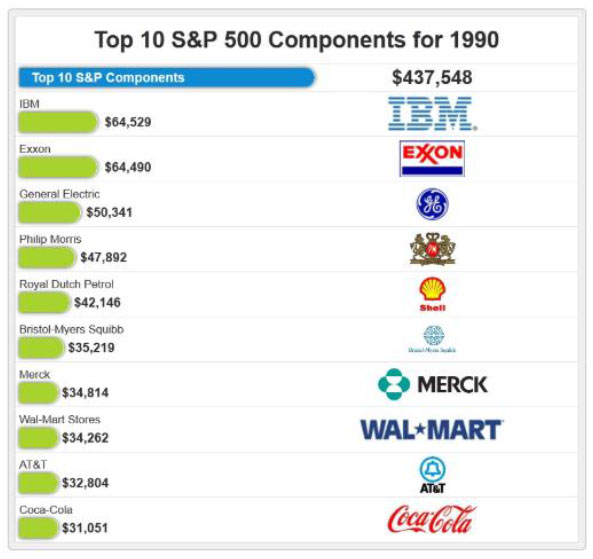
So, the composition of the S&P 500 (and the economy) continues to change. Technology companies now constitute a big weight (~ 25% in 2018 before reclassification14) of indices such as the S&P 500. We cannot overlook this fact in comparing the market today to valuations of yore.
As Warren Buffett has pointed out, today’s biggest companies (in the U.S., based on market capitalization) are technology companies that require little capital. Here is Buffett at the 2017 Berkshire Hathaway annual meeting, as reported by CNBC:
“I believe that probably the five largest American companies by market cap [Apple, Alphabet, Microsoft, Amazon and Facebook]…they have a market value of over two-and-a-half trillion dollars…and if you take those five companies, essentially you could run them with no equity capital at all. None15”.
According to CNBC, Buffett explained that “people don’t appreciate how much the world has changed and how fast it can change further now that the future biggest companies in the world can be built through the use of very little capital and software in a relatively short period of time16”.
The point is that the S&P 500 of today is structurally different than it was in the 20th century when U.S. stock valuations were lower. Today’s market has very significant weightings in technology companies that, unlike yesterday’s leaders of the Dow such as GE or U.S. Steel, are not capital intensive.
The march of productivity / innovation / human ingenuity in America have been key factors in making the U.S. economy dynamic and rewarding to investors. This dynamism is on full display in the changing composition of the S&P 500 Index over time.
We live in an era of technology disruption / innovation. We must not overlook the potential impact of these forces on the economy and stocks.
Getting back to Grantham – he notes that higher corporate profits may explain, in part, the higher valuations shown in his Exhibit 1, above. Consider the chart below:
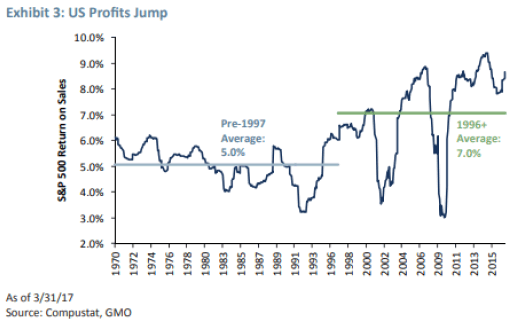
According to Grantham, “Compared to the pre-1997 era, the [S&P 500] margins have risen by about 30%17”. He concludes that, “With higher margins, of course the market is going to sell at higher prices”.
Grantham also argues that lower interest rates have been a factor to explain higher stock prices. To fully explain why this is so would require a lot of ink, so for brevity, we will say that interest rates impact stocks primarily in this way: Stocks compete with GIC’s and bonds for your investment dollars. Financial assets such as stocks are valued relative to prevailing yields on fixed income securities such as Government bonds. So, when interest rates are low, stock valuations can be bid up (I am generalizing here). Today, the “TINA” principle as at work – investors have been pouring into stocks because There Is No Alternative.
Putting it all together
So, just because stocks looks expensive and the bull market is now 10 years in the making does not necessarily mean that a correction is imminent. There are valid reasons (in our view) why stocks in Canada and the U.S. could continue to outpace GIC’s or other fixed income investments for years to come.There are many reasons for optimism including:
There are many reasons for optimism including:
- We cannot rule out the possibility that low interest rates and high corporate profits might persist for several years, buoying the stock market; and
- We must acknowledge the (mostly positive) impact of technology / disruption / innovation on the economy and the composition of stock indices such as the S&P 500. Today’s modestly higher valuations may well be warranted.
In closing, we would like to share Bill Miller’s perspective on the market (Q1 2019) that sets out the “bull” or optimistic case quite nicely:
“So what is going on now? The economy is in a long expansion which shows no signs of ending. The Fed is accommodative and has indicated it is in no hurry to raise rates. Inflation is low, interest rates provide no significant competition to stocks with bonds trading at 40x a cash stream that will not grow while stocks trade at 17x earnings and those should grow about 5%, or a bit more, long term. Dividends for the S&P 500 grew 9.9% for the four quarters ending March 31. There is plenty of room for dividends to grow faster than earnings since the current payout ratio is 35.5% compared to 52% on average since 2016. [Stock] buybacks are at record levels.
More generally, GDP is at an all-time high, corporate profits are at an all-time high, margins are at an all-time high, cash flows are at an all-time high, dividends are at an all-time high. Unemployment is at a 50-year low, initial claims for unemployment are at the lowest level relative to the population in history, household net worth is at an all-time high, consumer balance sheets are fine, and the savings rate at 6% is solid. There are more economic time series that are likewise in good shape, but the picture is clear. Usually when the economic data is that positive, stocks are at an all-time high, but they are not (yet).
The surprise would be if they don’t surpass the September 2018 highs. Stocks are in a bull market and bonds in the US are in a benign bear market that began in 2016 with yields just under 1.4%……..The path of least resistance for stocks remains higher”.
Best wishes to you and your family from your Apex team Advisors and staff: Shawn, Scott, Mike, John, Will, Denise E., Paul, Tina, Denise N., Lisa, Marta, Darlene and Sharon.
Disclaimer: The information contained herein was obtained from sources believed to be reliable, however, we cannot represent that it is accurate or complete. This report is provided as a general source of information and should not be considered personal investment advice or solicitation to buy or sell any securities mentioned. The views expressed are those of the author and not necessarily those of ACPI.
Aligned Capital Partners Inc. is a member of the Canadian Investor Protection Fund and the Investment Industry Regulatory Organization of Canada.
1 “These stocks are thousands of percent higher than they traded when the market hit its crisis-era low”, CNBC, Patti Domm & Gina Francolla, March 6, 2019, https://www.cnbc.com/2019/03/06/these-stocks-gained-the-most-since-the-market-hit-its-crisis-era-low.html
2 Mackenzie Investments, https://www.mackenzieinvestments.com/en/assets/documents/marketingmaterials/mm-bull-bear-markets-sp500-en.pdf
3 “Some Reflections on the Bull at 10”, Miller Value Partners. Bill Miller, April 17, 2019, https://millervalue.com/bill-miller-1q-2019-market-letter/
4 Trailing twelve months, https://www.multpl.com/s-p-500-pe-ratio
5 “This Time Seems Very, Very Different (Part 2 of Not with a Bang but a Whimper – A Thought Experiment)”, Q1 2017, Grantham Mayo. Jeremy Grantham
6 Ibid.
7 Ibid.
8 “’The yield curve is the best economist out there’: What Canada’s first inverted curve in 12 years tells us”, Financial Post, Bloomberg, Esteban Duarte, March 25, 2019, https://business.financialpost.com/news/economy/canadas-inverted-yield-curve-signals-holding-pattern-for-poloz
9 “The Yield Curve Is Inverted! Remind Me Why I Care”, Bloomberg, Brian Chappatta, March 22, 2019, https://www.bloomberg.com/news/articles/2019-03-22/the-yield-curve-is-inverted-remind-me-why-i-care-quicktake
10 “We still don’t understand the post-crisis economy, so don’t expect it to behave like the past”, Financial Post, Joe Chidley, https://business.financialpost.com/investing/investing-pro/we-still-dont-understand-the-post-crisis-economy-so-dont-expect-it-to-behave-like-the-past
11 “Some Reflections on the Bull at 10”, Miller Value Partners. Bill Miller, April 17, 2019, https://millervalue.com/bill-miller-1q-2019-market-letter/
12 http://siblisresearch.com/data/weights-sp-500-companies/
13 “History Of The S&P 500’s Biggest Components, The Big Picture”, Barry Ritholz, Feb. 5, 2013, https://ritholtz.com/2013/02/visual-history-of-the-sp-500/
14 “Tech dominates the S&P 500, but that’s not always a bad omen”, CNBC, Karen Firestone, April 20, 2018, https://www.cnbc.com/2018/04/20/tech-dominates-the-sp-500-but-thats-not-always-a-bad-omen.html
15 “Warren Buffett: It doesn’t really take any money to run the largest companies in America”, CNBC, John Melloy, May 6, 2017, https://www.cnbc.com/2017/05/06/warren-buffett-it-doesnt-take-any-money-to-run-largest-companies.html
16 Ibid.
17 “This Time Seems Very, Very Different (Part 2 of Not with a Bang but a Whimper – A Thought Experiment)”, Q1 2017, Grantham Mayo. Jeremy Grantham


